 Hispanopedia Wiki
En estadística , el método de Fisher , [ 1 ] [ 2 ] también conocido como prueba de probabilidad combinada de Fisher , es una técnica para la fusión de datos o " metaanálisis " (análisis de análisis). Fue desarrollado por Ronald Fisher , quien le dio su nombre . En su forma básica, se utiliza para combinar los resultados de varias pruebas de independencia que se basan en la misma hipótesis general ( H0 ).
Aplicación a estadísticas de pruebas independientes
El método de Fisher combina las probabilidades de valores extremos de cada prueba, comúnmente conocidas como " valores p ", en un estadístico de prueba ( X² ) utilizando la fórmula

donde p i es el valor p para la i- ésima prueba de hipótesis. Cuando los valores p tienden a ser pequeños, el estadístico de prueba X 2 será grande, lo que sugiere que las hipótesis nulas no son verdaderas para todas las pruebas.
Cuando todas las hipótesis nulas son verdaderas y los p i (o sus estadísticos de prueba correspondientes) son independientes, X 2 tiene una distribución chi-cuadrado con 2 k grados de libertad , donde k es el número de pruebas que se combinan. Este hecho se puede utilizar para determinar el valor p para X 2 .
The distribution of X2 is a chi-squared distribution for the following reason; under the null hypothesis for test i, the p-value pi follows a uniform distribution on the interval [0,1]. The negative logarithm of a uniformly distributed value follows an exponential distribution. Scaling a value that follows an exponential distribution by a factor of two yields a quantity that follows a chi-squared distribution with two degrees of freedom. Finally, the sum of k independent chi-squared values, each with two degrees of freedom, follows a chi-squared distribution with 2k degrees of freedom.
Limitations of independence assumption
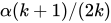
Dependence among statistical tests is generally positive, which means that the p-value of X2 is too small (anti-conservative) if the dependency is not taken into account. Thus, if Fisher's method for independent tests is applied in a dependent setting, and the p-value is not small enough to reject the null hypothesis, then that conclusion will continue to hold even if the dependence is not properly accounted for. However, if positive dependence is not accounted for, and the meta-analysis p-value is found to be small, the evidence against the null hypothesis is generally overstated. The mean false discovery rate, , reduced for k independent or positively correlated tests, may suffice to control alpha for useful comparison to an over-small p-value from Fisher's X2.

Extension to dependent test statistics
In cases where the tests are not independent, the null distribution of X2 is more complicated. A common strategy is to approximate the null distribution with a scaled χ2-distributionrandom variable. Different approaches may be used depending on whether or not the covariance between the different p-values is known.
Brown's method[3] can be used to combine dependent p-values whose underlying test statistics have a multivariate normal distribution with a known covariance matrix. Kost's method[4] extends Brown's to allow one to combine p-values when the covariance matrix is known only up to a scalar multiplicative factor.
The harmonic mean p-value offers an alternative to Fisher's method for combining p-values when the dependency structure is unknown but the tests cannot be assumed to be independent.[5][6]
Interpretation
Fisher's method is typically applied to a collection of independent test statistics, usually from separate studies having the same null hypothesis. The meta-analysis null hypothesis is that all of the separate null hypotheses are true. The meta-analysis alternative hypothesis is that at least one of the separate alternative hypotheses is true.
In some settings, it makes sense to consider the possibility of "heterogeneity," in which the null hypothesis holds in some studies but not in others, or where different alternative hypotheses may hold in different studies. A common reason for the latter form of heterogeneity is that effect sizes may differ among populations. For example, consider a collection of medical studies looking at the risk of a high glucose diet for developing type II diabetes. Due to genetic or environmental factors, the true risk associated with a given level of glucose consumption may be greater in some human populations than in others.
In other settings, the alternative hypothesis is either universally false, or universally true – there is no possibility of it holding in some settings but not in others. For example, consider several experiments designed to test a particular physical law. Any discrepancies among the results from separate studies or experiments must be due to chance, possibly driven by differences in power.
In the case of a meta-analysis using two-sided tests, it is possible to reject the meta-analysis null hypothesis even when the individual studies show strong effects in differing directions. In this case, we are rejecting the hypothesis that the null hypothesis is true in every study, but this does not imply that there is a uniform alternative hypothesis that holds across all studies. Thus, two-sided meta-analysis is particularly sensitive to heterogeneity in the alternative hypotheses. One sided meta-analysis can detect heterogeneity in the effect magnitudes, but focuses on a single, pre-specified effect direction.
Relation to Stouffer's Z-score method

Un enfoque estrechamente relacionado con el método de Fisher es el método Z de Stouffer, basado en puntuaciones Z en lugar de valores p , lo que permite la incorporación de ponderaciones de estudio. Recibe su nombre del sociólogo Samuel A. Stouffer . [ 7 ] Si definimos Z i = Φ − 1 ( p i ), donde Φ es la función de distribución acumulativa normal estándar , entonces

es una puntuación Z para el metaanálisis general. Esta puntuación Z es apropiada para valores p unilaterales de cola derecha ; se pueden realizar modificaciones menores si se analizan valores p bilaterales o de cola izquierda . Específicamente, si se analizan valores p bilaterales , se utiliza el valor p bilateral ( p i /2), o 1- p i si se utilizan valores p de cola izquierda . [ 8 ]
Dado que el método de Fisher se basa en el promedio de los valores de −log ( pᵢ ) y el método de la puntuación Z se basa en el promedio de los valores de Zᵢ , la relación entre estos dos enfoques se deriva de la relación entre z y −log ( p ) = −log (1 − Φ ( z )). Para la distribución normal, estos dos valores no están relacionados de forma perfectamente lineal, pero siguen una relación altamente lineal en el rango de valores de Z más frecuentemente observados, de 1 a 5. Como resultado, la potencia del método de la puntuación Z es prácticamente idéntica a la del método de Fisher.
Una ventaja del enfoque de puntuación Z es que es sencillo introducir ponderaciones. [ 9 ] [ 10 ] Si la i - ésima puntuación Z se pondera por w i , entonces la puntuación Z del metaanálisis es
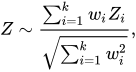
que sigue una distribución normal estándar bajo la hipótesis nula. Si bien se pueden derivar versiones ponderadas del estadístico de Fisher, la distribución nula se convierte en una suma ponderada de estadísticos chi-cuadrado independientes, lo cual resulta menos conveniente para trabajar.
Referencias
- ↑ Fisher, RA (1925). Métodos estadísticos para investigadores . Oliver and Boyd (Edimburgo). ISBN 0-05-002170-2.
{{cite book}}: Incompatibilidad de ISBN/Fecha ( ayuda ) - ↑Fisher, R.A.; Fisher, R. A (1948). "Questions and answers #14". The American Statistician. 2 (5): 30–31. doi:10.2307/2681650. JSTOR 2681650.
- ↑Brown, M. (1975). "A method for combining non-independent, one-sided tests of significance". Biometrics. 31 (4): 987–992. doi:10.2307/2529826. JSTOR 2529826.
- ↑Kost, J.; McDermott, M. (2002). "Combining dependent P-values". Statistics & Probability Letters. 60 (2): 183–190. doi:10.1016/S0167-7152(02)00310-3.
- ↑Good, I J (1958). "Significance tests in parallel and in series". Journal of the American Statistical Association. 53 (284): 799–813. doi:10.1080/01621459.1958.10501480. JSTOR 2281953.
- ↑Wilson, D J (2019). "The harmonic mean p-value for combining dependent tests". Proceedings of the National Academy of Sciences USA. 116 (4): 1195–1200. Bibcode:2019PNAS..116.1195W. doi:10.1073/pnas.1814092116. PMC 6347718. PMID 30610179.
- ↑Stouffer, S.A.; Suchman, E.A.; DeVinney, L.C.; Star, S.A.; Williams, R.M. Jr. (1949). The American Soldier, Vol.1: Adjustment during Army Life. Princeton University Press, Princeton.
- ↑"Testing two-tailed p-values using Stouffer's approach". stats.stackexchange.com. Retrieved 2015-09-14.
- ↑Mosteller, F.; Bush, R.R. (1954). "Selected quantitative techniques". In Lindzey, G. (ed.). Handbook of Social Psychology, Vol. 1. Addison_Wesley, Cambridge, Mass. pp. 289–334.
- ↑Liptak, T. (1958). "On the combination of independent tests"(PDF). Magyar Tud. Akad. Mat. Kutato Int. Kozl. 3: 171–197.
See also
- Extensions of Fisher's method
- An alternative source for Fisher's 1948 note:
- El método de Fisher, la puntuación Z de Stouffer y algunos métodos relacionados están implementados en el paquete metap de R.
- Pruebas estadísticas
- Metaanálisis
- Ronald Fisher